

Control Comparison
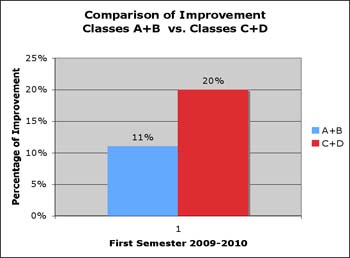
In the fall semester when classes C and D received the program and A and B did not, classes C and D performed 9 % better.
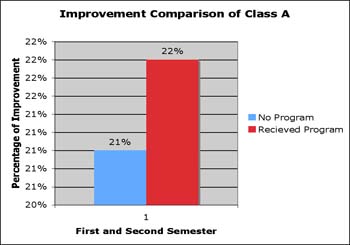
In the spring, when class A received the program it improved slightly, but this class according to the teacher was well behaved and didn’t have much room for improvement.
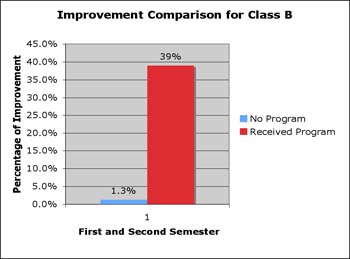
Class B, which showed the greatest gain, was the teacher’s most difficult class. This class showed remarkable improvement in the areas of focus, initiative, cooperation, and completion of assignments.
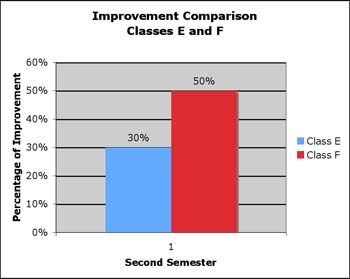
Classes E and F, also classes with challenging students, showed a marked 30% and 50% improvement in the second semester when they received the program. Introducing the program to these two classes also provided us with additional data that shows this program is very useful for children with behavior or learning challenges.
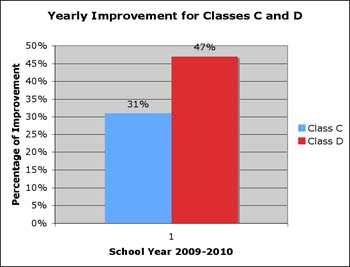
Classes C and D, which received the program both in the fall and spring semester of the school year of 2009-2010 made a 31% and 47% annual improvement.